


Introduction
The high prevalence of pressure ulcers is contributing to rapid increases in medical expenses [1], a trend that seems to accelerate further with the aging of the population. Therefore, effectively managing pressure ulcer wounds, including clinical assessment of the changing status of wounds, is becoming increasingly important.
VanGilder et al. [2] reported the overall prevalence of pressure ulcers in all medical facilities was 9.3%, and according to research findings from the International Pressure Ulcer Prevalence Survey, facility-acquired pressure injuries accounted for about onethird. As managing pressure ulcers becomes an increasing burden, clinicians will need an easier and more cost-effective wound monitoring system. Accordingly, various wound monitoring tools have been appraised using advanced medical technology [3-6].
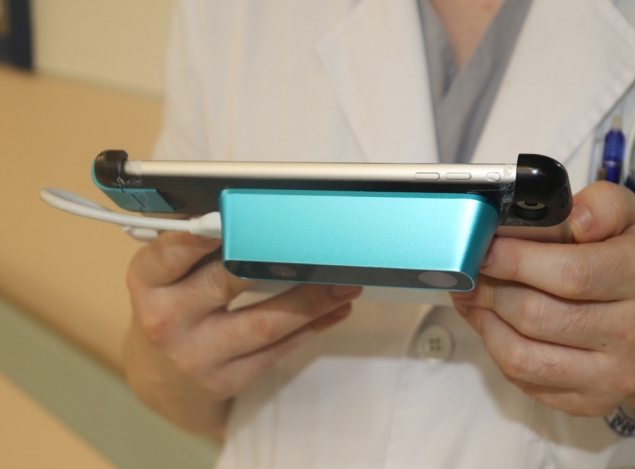
A mobile three-dimensional measurement system (3DWMS) with a laser-assisted sensor camera was recently introduced in several studies (Fig. 1) [7-11]. However, those studies used only standardized wound models or simple wounds without complex margins. Moreover, all previous studies lacked a precise procedure to obtain reference values for wound volume, even though the studies employed three-dimensional assessment tools.
In this study, we used the 3DWMS in actual clinical cases dealing with patients with pressure ulcer wounds. All the reference values for each wound, including volume data, were measured manually. We particularly took care to assess not only the equivalence of the values measured by the 3DWMS and the physical measurements, but also whether the two methods of measuring were interchangeable in clinical environments.
Method
Selection criteria
A total of 232 pressure injuries found on different body sites with various sizes and shapes were retrospectively reviewed from October 2017 to December 2018. This population included open ulcers that were physically discernable with partial-thickness or full-thickness skin and tissue loss. The measurements of the same wounds in follow-up assessments were excluded from the database, ensuring one wound would have only one set of measurements. Wounds with non-valid measurements, measurements with poor quality, or missing data were excluded. The wounds were classified according to the definitions of the National Pressure Ulcer Advisory Panel (NPUAP). The requirement for informed consent was waived, and this investigation was approved by the Institutional Review Board of Konkuk University Medical Center (IRB No. KUMC 2019-07-046).
Three-dimensional wound measurements
All assessments were performed after the wounds were cleansed, and if necessary, surgically debrided. In this study, eKare inSight (eKare Inc., Fairfax, VA, USA) was used for three-dimensional wound assessments. The system includes a three-dimensional camera device, which consists of an iPad mini (Apple, Cupertino, CA, USA) and Structure Sensor (Occipital, San Francisco, CA, USA), including application and online database services available at https://ekare.ai (Fig. 2A). The wound regions were analyzed using the structure sensor, after which three-dimensional maps for the wound sites were obtained. Upon this mapped data of the wound, the measurements of the widths, lengths, depths, surface areas and volumes were calculated (Fig. 2B).
Reference wound measurements
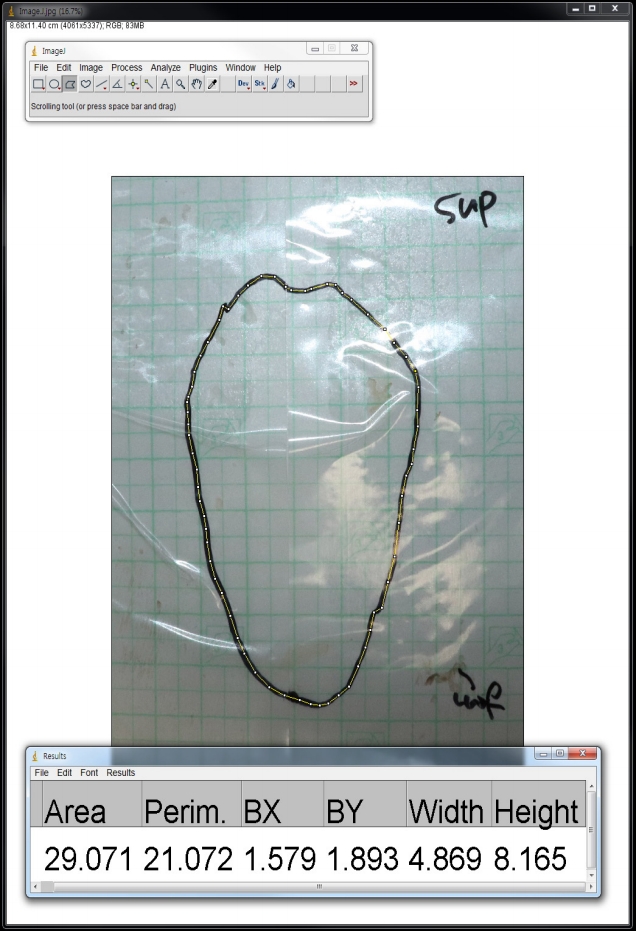
To obtain accurate reference values, we used transparent adhesive films for two-dimensional planimetry. Using Opsite Flexigrid (Smith & Nephew, Watford, UK), the exact outlines of the wounds were traced with a permanent marker on the adhesive film. Afterwards, the widths, lengths, and surface areas of the wounds were measured using image analyzing software (ImageJ; National Institutes of Health, Bethesda, MD, USA) (Fig. 3).
After measuring the maximum depths of the wound with sterile rulers, we filled the wound with saline to measure the volume. For saline filling, we first applied transparent adhesive film to seal the pressure ulcer wound, and after completely covering the surface of the wound with the film, we injected saline with syringes. We recorded the volume of the injected saline when the space was full. If depth of the wound was too small to measure, or measured to be 0, particularly in stage II ulcers, the max depth values were documented as zero, and accordingly, the paired volume values were also recorded as zero.
Statistical analyses
Statistical analysis was performed with SPSS for Windows version 17 (SPSS Inc., Chicago, IL, USA). The results were expressed as mean±standard deviation or percentages (%). The paired samples t-tests were used to compare the values, and a value of P<0.05 was considered to be statistically significant. For further analysis of agreement between the two measurements, we used the Bland-Altman plot (difference plot).
Results
A total of 26 pressure ulcer wounds were reviewed. Based on NPUAP staging, 12 wounds (46.2%) were classified as stage II, eight (30.8%) as stage III, and six (23.1%) as stage IV. For regions of injury, five (19.2%) were on the foot and ankle area, 19 (73.1%) were on the sacral area, and two (7.7%) were on the trochanteric area (Table 1).
The mean widths of the wounds in the reference and 3DWMS groups were 5.85±3.97 and 5.88±4.21 cm respectively, and the P-value of the paired samples t-test was 0.863. The mean lengths were 6.20±4.13 and 5.91±3.90 cm (P=0.155), and mean maximum depths were 1.53±1.46 and 0.84±0.75 cm (P=0.000). The mean surface areas were 37.14± 41.47 and 36.95±39.54 cm2 (P=0.838), and mean volumes were 88.92±145.06 and 20.13±31.73 cm3 (P=0.005). The mean differences between the two groups were not significant for width, length, and surface area (P>0.05), whereas the mean differences for maximum depths and volumes were found significant (P<0.05) (Table 2).
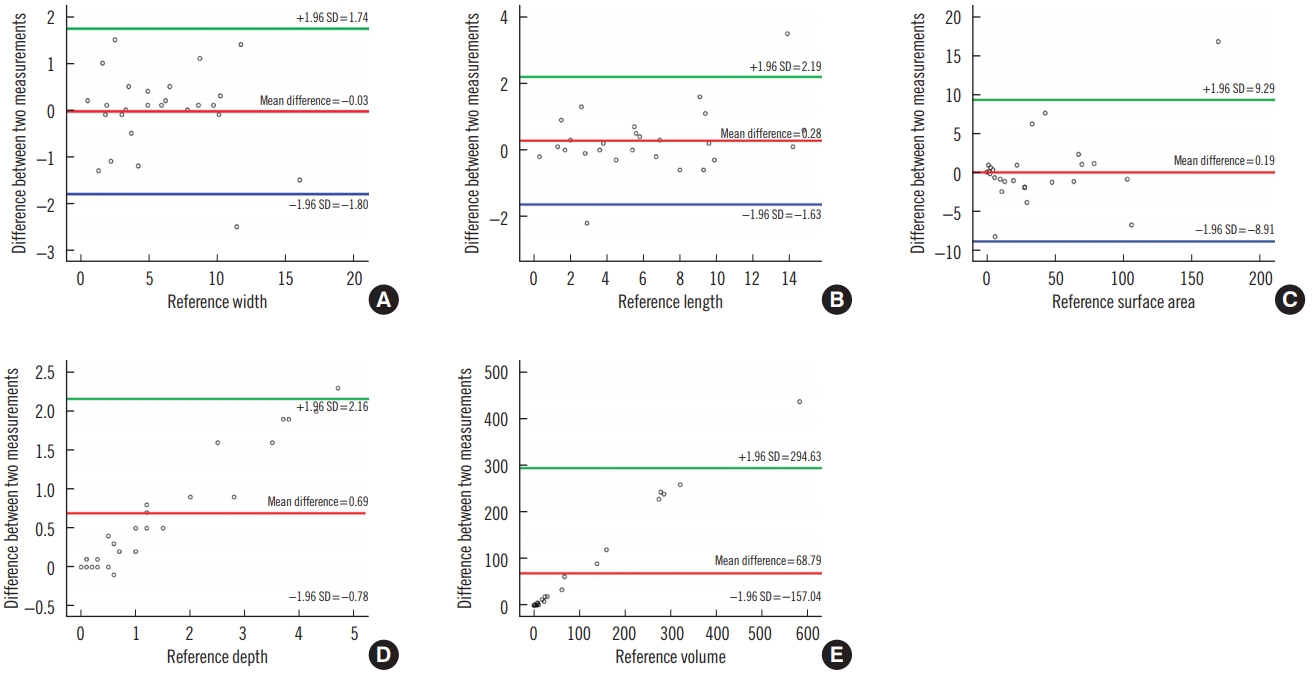
A table for the Bland-Altman plotting was prepared (Table 3). The mean of the differences between the two measurement groups for widths, lengths, maximum depths, surface areas, and volumes were −0.03, 0.28, 0.69, 0.19, and 68.79. The standard deviations thereof were 0.90, 0.98, 0.75, 4.64, and 115.22. The upper and lower limits of agreement (LoA) were 1.74, 2.19, 2.16, 9.29, 294.63 and −1.80, −1.63, −0.78, −8.91, −157.04, respectively.
These statistics were used to create the Bland-Altman plot for each group (Fig. 4). The plotted dots of the differences between the two measurements of the width, length and surface area showed randomly scattered patterns with several outliers (Fig. 4A-C). The plotted dots of differences for the maximum depth and volume showed linear scattered patterns resembling an upward-sloping curve to the right (Fig. 4D and E).
Discussion
Bills et al. [10] analyzed the clinical accuracy of the 3DWMS using three artificial wound models, whereas Sheng et al. [11] used seven animal wound models for the same purpose. In both studies, the 3DWMS turned out to be quite reliable, particularly in measuring two-dimensional parameters such as widths, lengths, and surface area. However, those studies were limited in that they were based on the pre-made simple wounds without complex contours or three-dimensional structures. In comparison, Goto et al. [9] used clinically presented practical wounds and showed the efficacy of the 3DWMS in measuring widths, lengths, and surface areas. However, this study found the depth measurements from the 3DWMS to be not clinically reliable.
In our study, we tried to obtain all three-dimensional reference values of the pressure ulcer wounds including exact depths and volumes. Two-dimensional values of planimetry, such as widths, lengths and surface areas, are relatively easy to measure with accuracy because there is little surface irregularity. However, in three-dimensional analysis, there exist more complex structures and measuring volumes of space is difficult [12]. To overcome this limitation, we used the saline filling technique to measure the volumes of irregularly shaped pressure ulcer wounds (Fig. 5). We could thereby significantly lower the risk of erroneous measurements; thus the volumetric measurements are considered highly reliable.
Our results from the paired sample t-tests showed that the measurements of maximum depths and volumes in the 3DWMS were significantly different from the reference measurements. One of the reasons was the irregular three-dimensional shapes of the wounds. As illustrated in Fig. 5, if the pressure injury at its deepest point is obscured by outer surface tissue, the 3DWMS can assess neither the exact depth nor the volume of the wound. Additionally, the 3DWMS uses reflections of infrared radiation to determine the assessment points of the wounds and is therefore reliable in measuring widths, lengths, and surface areas. However, this does not apply to measuring depths and volumes, as infrared radiation may not reflect properly within the injury [9].
For further analysis, we used the Bland-Altman plot, which is well known as an effective statistical tool for comparing two measurement techniques [13-15]. In this graphical analysis, the agreement between the X and Y values was plotted within LoA around the mean difference of the 3DWMS and reference values. According to the results of the plotting, the values of widths, lengths and surface areas were randomly scattered (Fig. 4A-C), meaning they were not affected by any systemic bias. However, the plottings of maximum depths and volumes resulted in steep upward-sloping curves (Fig. 4D and E). This means the differences increased in larger wounds. Statistically, this suggests a proportional error in the measurements [16].
As for the values and ranges of LoA lines, the differences between the upper and lower LoA values were 3.54 cm for width, 3.82 cm for length, and 18.2 cm2 for surface area. These ranges seemed too disproportionately large to ignore when assessing wounds, because the mean width, length and surface area values of the pressure ulcer wounds were only 5.85 cm, 6.20 cm and 37.14 cm2, respectively. The reason for the large differences in the LoA values is most likely several outliers in the measurements. Even though the results of the paired samples ttests showed that the differences between the mean values of the widths, lengths and surface areas were insignificant, the Bland-Altman plot makes it difficult to assume the two methods of measurement are interchangeable [16,17].
There were several limitations in our study. First of all, the results could differ in other clinical circumstances. For example, surface area measurements can differ by up to 10% depending on the angle of the camera [18]. Patients suffering from pressure injuries are typically not able to maintain steady positions long enough for standard wound assessment photography. This may lead to measurement errors in the 3DWM method, whereas in the reference measurements, the use of adhesive transparent film prevents changes in the patient’s position from affecting the results.
In our study, intraoperator and interoperator consistency was not assessed. Both manual and 3DWMS methods include outlining of the wound margins; the results may depend on the skill of the clinicians. Therefore, several outlier measurements may result from the poor outlining skills of the assessors.
In conclusion, thanks to its features enabling easy calculation of wound sizes and its straightforward interface for online medical documentation, 3DWMS has emerged as a new means for assessing pressure ulcer wounds. The device provided reliable results in two-dimensional area analysis, whereas its results in three-dimensional analysis such as depths and volumes were relatively less suitable to use in clinical environments. Therefore, clinicians are advised to be mindful of the strengths and weaknesses of different methods when measuring pressure ulcer wounds.